Fundamental Analysis involves examining economic and financial factors.
Here are some aspects you need to understand about the company you wish to invest in:
- Stock Screening: Important factors to consider when selecting a suitable stock for investment.
- Company Structure: Understanding the company’s organizational setup.
- Competitors: Identifying the company’s competitors.
- Intrinsic Value of Stock: Determining the true value of the company’s stock.
- Reading Financial Statements: Analyzing the company’s financial statements.
- Future Opportunities: Analyzing future financial reports.
Key Factors for Analysis:
A) Financial Factors: (Financial Report)
B) Economic Factors: (Economic Report)
Considerations:
- Profit and Loss Statements
- Revenue
- Operations
- Debts
- Cash Reserves
- Competencies
Fundamental Analysis involves understanding the following aspects:
- Liquidity
- Profitability
- Price of the Stock
- Leverage
Liquidity:
The term liquidity refers to how quickly and easily a stock can be bought or sold in the market. It indicates the ease with which a stock can be converted into cash without significantly impacting its market price. Cash is considered the most liquid asset.
At the same time, stable stocks are less liquid . (buy/sell tradinding (Liquidity)
Two types of Ratio:
- Current Ratio
- Quick Ratio
Current ratio:
=Current Assets/Current Liabilities
Quick Ratio:
=Current Assets-Inventory / Current Liabilities
Good Range for selection= >1 (Greaterthan1)
Good Selection Range more than 1 %.
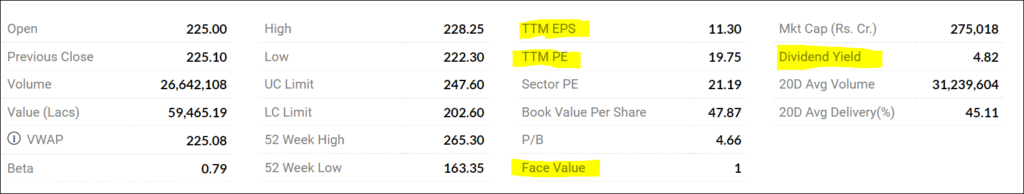
EPS (Earnings Per Share):
Earnings Per Share (EPS) is a statistic that describes the profit allocated to each outstanding share of a company. It is calculated on a quarterly or annual basis. EPS is determined by dividing a company’s net income for the period by the number of outstanding shares.
EPS serves as a fundamental measure of a company’s profitability and helps investors gauge whether a company is a good investment.
EPS = Net Income for the Period / Number of Outstanding Equity Shares
For example:
EPS = 200 Crores / 5 Crores
EPS = Rs. 40
TTM PE (Price to Earnings):
The Price-to-Earnings (P/E) ratio links a company’s stock price to its earnings per share. A high P/E ratio may indicate that a company’s stock is overvalued or that investors expect high growth rates in the future.
P/E Ratio = Current Market Price of a Share / Earnings per Share
The market average P/E ratio currently ranges from 20 to 25.
Leverage:
Leverage involves using borrowed funds to increase the potential return on an investment. It is a strategy that amplifies the effect of debt on the company’s operations.
Leverage is measured by the Debt-to-Equity Ratio:
Debt-to-Equity Ratio = Debt / Equity
Good Selection Range = <1 (Less than 1)
Profitability:
- Return on Equity (ROE): ROE measures how effectively a company uses shareholders’ equity to generate profit. ROE = Net Income (Annual) / Shareholders’ Equity Good Selection Range = 15% to 20%
- Return on Assets (ROA): ROA indicates how efficiently a company uses its assets to generate operating income. ROA = Operating Income / Total Assets Good Selection Range = More than 5%
- EBITDA: EBITDA stands for Earnings Before Interest, Taxes, Depreciation, and Amortization. It measures a company’s overall financial performance. EBITDA = Net Income + Taxes + Interest Expenses + Depreciation & Amortization A good selection range for EBITDA should be increasing annually.
- Dividend Yield: Dividend Yield measures the return on investment based on dividends received. Dividend Yield = Dividend per Share / Stock Price